One of the greatest challenges to managing cyber risk is communications. Often the technologies and tools used to deploy effective countermeasures, monitor activity on networks, and online points of contact between an enterprise and its stakeholders, clients, customers, and partners are described using language uncommon to non-technical audiences. Also lost to those outside cybersecurity and risk management practices are the context essential to understanding the impact, implications, and scope of findings represented by cyber risk and security data.
As a leader in cyber risk and security management, you need to respond to these challenges effectively to foster support for cyber risk program funding, partnership across stakeholder groups, and attention to the practices, policies, education, and vigilance essential to a high functioning cyber risk program.
Organizing for Business Clarity
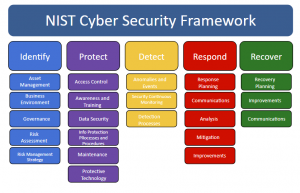
Looking at the raw data piles, this may seem a daunting task. To untangle the mass of interesting, but seemingly abstracted data, consider using one or more organizing structures from frameworks whose controls or tenants you’ve employed in developing the content of your assessment. These often point to groupings of content that can be represented in non-technical business terms, such as securing data, asset management, threat detection, and more. The NIST Cybersecurity Framework offers an excellent foundation for organizing cyber risk assessment findings into easier-to-understand business-like categories.
Figure 1: NIST Cybersecurity Framework 1.1

Make selections that fit your assessment content. It’s straightforward to lead a discussion around where you stand regarding these foundational practices, reporting your current findings, what your target level or goal is for program maturity in each area, and what actions are being taken to achieve them.
Presenting With Context
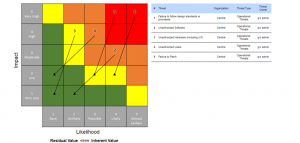
Within each data grouping, you can array your findings based upon risk scores. Heatmaps are effective for presenting such arrays visually and communicate trends or critical areas well. Title heatmaps and other charts with declarative statements of what the findings indicate to you as a professional. Those declarative titles help position the findings’ meaning. They also foster focus on the critical issues that require management attention; implying the relative achievement of low residual risk findings in areas where processes and practices are mature and functioning to deliver intended outcomes.
Figure 2: Development Standards Adherence and Patching Standards Need Attention

In this context, it’s clear where attention is needed and the heatmaps provide context for presentation of recommendations, current plans under development, and any other remedial actions appropriate to the findings. Heatmaps also allow you to discuss the distribution of risk findings within a category, communicating completeness of coverage, while supporting explorations of detail through drill down services. It is critical that your software provides this feature.
You can also present an array of heatmaps, if you wish to present the variance of findings on a particular category across several organization units. At a Board level, this can be very useful, particularly if one business area stands out as significantly different than others. Risk data doesn’t lend itself well to analysis through arithmetic means, averages, other statistical tools. It does lend itself to distributions, which is one reason why heat maps are such effective communicators.
Figure 3: Representing Progress Towards Gap Closure

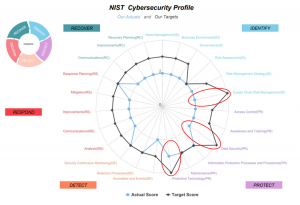
Simple line charts are also effective at representing gap closure progress against target states. This example shows the relative risk at the current state, the prior state, and the target for the category. Progress is clear. Remedial plans to achieve the target state can be discussed while noting that much of the distance has been closed and significant progress achieved to date. The discussion, while still generally qualitative, has context and greater meaning when presented this way. Polar displays also can be used to represent the difference between current and target states. They are particularly useful when displaying this data for multiple categories in one display. As you can see immediately in figure 4 below, Supply Chain, Data Security and Protective Technology components of this form’s cyber risk program are most in need of attention.
Figure 4: Representing A Consolidated View of Gap Status Highlights Opportunities

Hitting the Highlights
Senior Executives often want to cut right to the top line findings. So, have the top five (5) risks within each major category and the top highest scoring ones overall across your assessment ready for review. This sets the stage for the detail to follow. If the risk of avoiding detection of cyber-attack is high while recovery processes and practices are well formed, understood, and the related recovery risk is low, you need to be ready for a business discussion on what that means for the business. This is the discussion your management teams wants. They look to the cyber risk professionals to advise them on where their greatest risks are, how they might impact achievement of company goals and mission, and what actions would best remedy the situation to enable the organization to continue to serve customers and achieve goals in the most effective way.
With this in mind have answers to some basic, but key questions:
- Where is our greatest concentration of risk?
- What is the most significant threat we face where our countermeasures are lacking?
- What is/are the one, two, or three things we can begin to do now to significantly improve our readiness and reduce cyber risk?
- Do we have the talent and resources to act effectively?
- How can we leverage efforts by operation, audit, IT, and others to help reduce cyber risk?
The Last Word
Context adds the dimensions of meaning and value to risk assessment findings. Too much data confuses and clouds otherwise organized, clear messaging.
Organization affords clarity, and charts support the effort. One of the most effective tests for the utility of a metric, or a reported finding, is the completion of this simple sentence:
“As a result of knowing this we will want to take [fill in the blank] action.”
As a result of reviewing and discussing your risk assessment findings report, executives and senior management should be informed well enough to begin to direct and prescribe actions. Reporting on assessment results is a critical component of a comprehensive, well integrated cyber risk program. The effort fuels and supports the continued flow of quality resources and attention needed to be current, efficient, and effective at managing cyber risk across your enterprise. Informed executives, stakeholders, and partners are some of the best assets one can apply to the tasks at hand. Cyber security and risk management are most successful when clear, timely communication is a tenant of your program.
About the Author:
Simon Goldstein is an accomplished senior executive blending both technology and business expertise to formulate, impact, and achieve corporate strategies. A retired senior manager of Accenture’s IT Security and Risk Management practice, he has achieved results through creation of customer value, business growth, and collaboration. An experienced change agent with primary experience in financial, technology, and retail industries, he’s led efforts to achieve ISO2700x certification and HIPAA compliance, as well as held credentials of CRISC, CISM, CISA.


One thought on “Reporting Risk Assessment Findings… enriching content with context”